What is the article’s topic means?
Last Updated on July 18, 2023 by Editorial Team
Author(s): Akash Dawari
Originally published on Towards AI.
Quantify the Performance of Classifiers

In this article, we will discuss the following question and try to find the answer to them.
- What is the article’s topic means?
- What is a confusion matrix?
- What are Accuracy, Precision, and Recall?
- What is F1-score?
- What are ROC and AOC stand for?
- How do implement these things in python?
In machine learning, after training the model with the training dataset we have to now evaluate the trained model with the test data. In regression models, we have different metrics like R squared score, Mean Squared Error, etc. Metrics In a regression problem, the accuracy is generally measured in terms of the difference between the actual values and the predicted values. In a classification problem, the credibility of the model is measured using the confusion matrix generated, i.e., how accurately the true positives and true negatives were predicted. So, now let’s understand the confusion matrix.
What is a confusion matrix?
It is a matrix that is used to evaluate the performance of any classifier. In other words, A confusion matrix visualizes and summarizes the performance of a classification algorithm. Let us take a simple binary classification, then the confusion matrix will look like the below picture.

True Positive(TP): A result that was predicted as positive by the classification model and also is positive
True Negative(TN): A result that was predicted as negative by the classification model and also is negative
False Positive(FP): A result that was predicted as positive by the classification model but actually is negative
False Negative(FN): A result that was predicted as negative by the classification model but actually is positive.
What are accuracy, precision, and recall?
Accuracy:
Accuracy can be said that it’s defined as the total number of correct classifications divided by the total number of classifications.

Precision:
Precision is a measure of amongst all the positive predictions, how many of them were actually positive.

So we have seen the formula and the definition of precision but to better understand let’s take an example. Consider we have a problem statement that we have to classify whether a person is guilty of a crime or not. So in this case, we have to build a model which focuses on accurately predicting true positives (i.e. he/she is guilty) only. By doing this the model may lose some actual guilty person. Cause if we think it is good to let go of a person having a crime rather than a person not attempted a crime and sentenced to be guilty. So, by using precision we can measure how the model is predicting true positives among the actual positive and false positives.
Recall:
The recall is a measure of- the total number of positive results and how many positives were correctly predicted by the model. It shows how relevant the model is, in terms of positive results only.

So we have seen the formula and the definition of recall but to better understand let’s take an example. Consider we have a problem statement that we have to classify whether a patient has cancer or not. So in this case, we have to build a model which focuses on predicting as many cancer patients as it can. In this process, the model may predict patient does not have cancer as true. But if we think, it is good to predict a patient having cancer rather than not predicting a patient who is actually suffering from cancer.
The trade-off between Precision and Recall
Precision and recall show a weird relationship between them as if you want to achieve precision then the recall of the model will drop and vice versa. Let’s take an example to imagine a scenario, where the requirement was that the model recalled all the defaulters who did not pay back the loan. Suppose there were 10 such defaulters and to recall those 10 defaulters, and the model gave you 20 results out of which only the 10 are the actual defaulters. Now, the recall of the model is 100%, but the precision goes down to 50%.
we can observe this behavior in the below graph.

As we can observe that if we increase the recall then the precision is drastically decreased. So, the question comes up how do we choose what is the right metric for evaluating our model. So, the simplest answer is that it depends on the problem statement. if you are predicting cancer, you need a 100 % recall. But suppose you are predicting whether a person is innocent or not, you need 100% precision. But another question comes up is that, how can we measure the overall performance of the model. So the answer would be the F1 score which we will understand next.
What is F1-score?
it is clear that we need a metric that considers both Precision and Recall for evaluating a model. One such metric is the F1 score. F1 score is defined as the harmonic mean of Precision and Recall.

What are ROC and AOC stand for?
Before we jump to understand ROC and AOC. we first understand why we need them. SO, if we observed most classification model gives us a probability of a class, it does not gives a hard value like 0 and 1. There comes the concept of Threshold. A threshold is set, any probability value below the threshold is a negative outcome, and anything more than the threshold is a favorable or positive outcome.
Now, the question is, what should be an ideal threshold? To answer this let's understand ROC.
ROC (Receiver operating characteristic) Curve

Mathematically, it represents the various confusion matrices for various thresholds. Each black dot is one confusion matrix. The green dotted line represents the scenario when the true positive rate equals the false positive rate. As evident from the curve, as we move from the rightmost dot towards the left, after a certain threshold, the false positive rate decreases. After some time, the false positive rate becomes zero. The point encircled in green is the best point as it predicts all the values correctly and keeps the False positives to a minimum. But that is not a rule of thumb. Based on the requirement, we need to select the point of a threshold. The ROC curve answers our question of which threshold to choose.
Let’s suppose that we used different classification algorithms, and different ROCs for the corresponding algorithms have been plotted. The question is: which algorithm to choose now? To answer this let's understand AOC.
AOC (Area Under Curve)

AOC helps us to choose the best model amongst the models for which we have plotted the ROC curves. The best model is the one that encompasses the maximum area under it.
How do implement these things in python?
Now, as we learned all the things theoretically let's get our hands dirty by writing some codes.
Importing essential modules and packages from python.

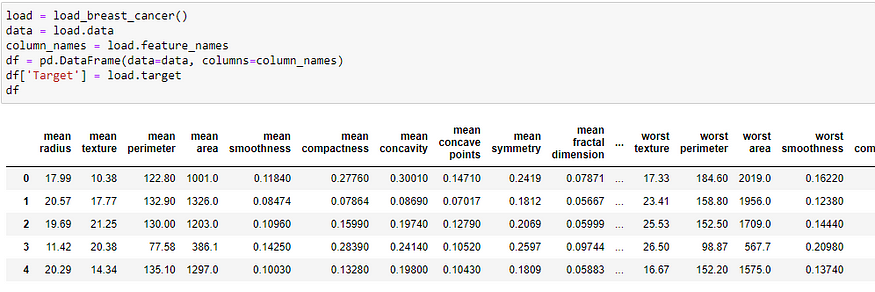
loading a toy dataset from sklearn.

Now train test split as we are focusing on accuracy, F1 score, etc. So, we are not pre-processing or performing any EDA on the dataset.

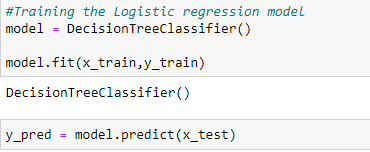
Training and predicting the data.

Now, we will evaluate the performance of your classifier.

Accuracy:

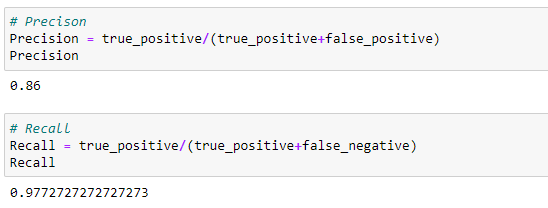
Precision and Recall:

F1-Score:

link of the notebook used in this article:
Articles_Blogs_Content/Quantify the Performance of Classifiers.ipynb at main ·…
This repository contain jupyter notebooks regarding to the Articles published in blogs. …
github.com
Like and Share if you find this article helpful. Also, follow me on medium for more content related to Machine Learning and Deep Learning.
Join thousands of data leaders on the AI newsletter. Join over 80,000 subscribers and keep up to date with the latest developments in AI. From research to projects and ideas. If you are building an AI startup, an AI-related product, or a service, we invite you to consider becoming a sponsor.
Published via Towards AI
Take our 90+ lesson From Beginner to Advanced LLM Developer Certification: From choosing a project to deploying a working product this is the most comprehensive and practical LLM course out there!
Towards AI has published Building LLMs for Production—our 470+ page guide to mastering LLMs with practical projects and expert insights!

Discover Your Dream AI Career at Towards AI Jobs
Towards AI has built a jobs board tailored specifically to Machine Learning and Data Science Jobs and Skills. Our software searches for live AI jobs each hour, labels and categorises them and makes them easily searchable. Explore over 40,000 live jobs today with Towards AI Jobs!
Note: Content contains the views of the contributing authors and not Towards AI.


