Role of Data Visualization in Machine Learning
Last Updated on July 24, 2023 by Editorial Team
Author(s): Benjamin Obi Tayo Ph.D.
Originally published on Towards AI.
Data visualization plays an integral role in machine learning from data analysis to model building, testing, evaluation, and selection

Image by Benjamin O. Tayo
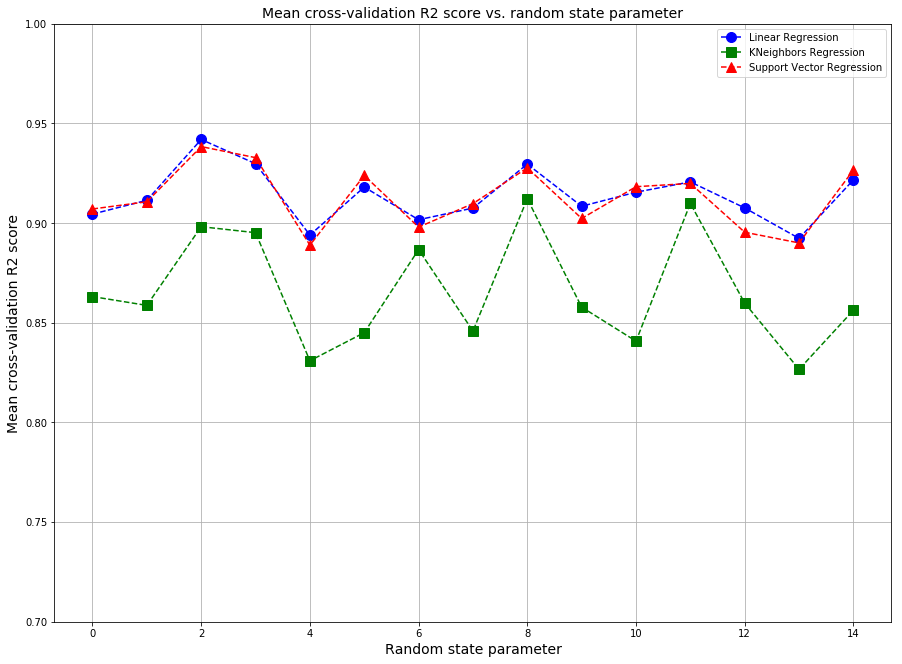
Data Visualization is one of the most important branches of data science. It is one of the main tools used to analyze and study relationships between different variables. Data visualization can be used for descriptive analytics. Data visualization is also used in machine learning for data preprocessing and analysis; feature selection; model building; model testing; and model evaluation.
In this article, we illustrate the role of data visualization in the machine learning process. For illustrative purposes, we will be using the cruise ship dataset cruise_ship_info.csv. The dataset and Jupyter notebook for this article can be downloaded from… Read the full blog for free on Medium.
Join thousands of data leaders on the AI newsletter. Join over 80,000 subscribers and keep up to date with the latest developments in AI. From research to projects and ideas. If you are building an AI startup, an AI-related product, or a service, we invite you to consider becoming a sponsor.
Published via Towards AI
Take our 90+ lesson From Beginner to Advanced LLM Developer Certification: From choosing a project to deploying a working product this is the most comprehensive and practical LLM course out there!
Towards AI has published Building LLMs for Production—our 470+ page guide to mastering LLMs with practical projects and expert insights!

Discover Your Dream AI Career at Towards AI Jobs
Towards AI has built a jobs board tailored specifically to Machine Learning and Data Science Jobs and Skills. Our software searches for live AI jobs each hour, labels and categorises them and makes them easily searchable. Explore over 40,000 live jobs today with Towards AI Jobs!
Note: Content contains the views of the contributing authors and not Towards AI.


