


MLOps Notes- 2: Deployment Overview
Last Updated on January 5, 2023 by Editorial Team
Author(s): Akhil Theerthala
Originally published on Towards AI the World’s Leading AI and Technology News and Media Company. If you are building an AI-related product or service, we invite you to consider becoming an AI sponsor. At Towards AI, we help scale AI and technology startups. Let us help you unleash your technology to the masses.
Hello everyone! Welcome back to the MLOps series. Here I will keep uploading my notes for the Machine Learning Engineering for Production Specialization offered by DeepLearning.AI on Coursera. We are currently in the first course, Introduction to Machine Learning in Production, which is taught by the legend, Andrew Ng himself, where we get an overview of each of the steps involved in the production environment.
This article deals with the overview of Deployment in production, as mentioned in my previous articles. If you haven’t read the previous article, then I recommend you to check it out here, as there might be some references to previous articles.
First, let’s look at some of the most common problems that come up during deployment.
There are two main types of problems that come up during the process. One type is model-related issues or Statistical issues, and the other kind is software-related issues.
Concept Drift/ Data Drift: (Statistical issue)
- This is observed when the inherent distribution of data from the traffic changes from the data distribution used for training and testing the model.
- It might be due to many reasons, like time, different lightning, changes in dialects, etc.,
- These changes might be either gradual or sudden shocks.
Software Engineering Issues: (Here are a few questions or points that we generally ask for defining a production service)
- Is the system a Real-time prediction system, or is it a batch process that runs overnight?
- Is it run in the cloud or Edge device?
- How many resources does the full-service use?
- What is the latency and throughput (QPS) of the service?
- Logging for analysis and review.
- Security and privacy issues.
To recall, we have defined 2 different parts of the deployment; one is writing the code for the software, and the other is maintaining the systems.
Deployment Patterns
Depending on the use case, we have different patterns for different stages of deployment. Some of the scenarios of deploying are,
- If we offer a new product/service, we generally start by providing it to a small amount of traffic and gradually opening it up.
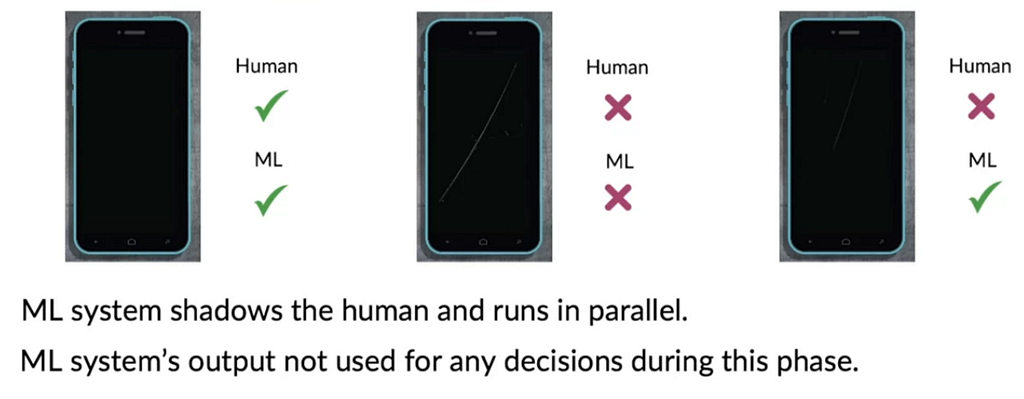
- If we automate/assist a manual task, we see that shadow mode deployment is a better approach.
- If there is already a previous version that is being replaced, the Blue-green pattern is recommended.
But, in all the cases, we see the following key ideas underneath,
- Gradually increasing the traffic with monitoring after getting proof that the system is working. (Canary)
- Making Rollback to previous versions possible.
Some common deployment patterns:
- Shadow mode: We first make the ML system run parallelly along with the model, where we only consider Human interpretation as the final result, and then, after monitoring and proving that it is making good decisions, we replace the human.
- A typical deployment pattern, in this case, is called Canary deployment, where we initially roll out to a small fraction (5%) of traffic and ramp up the traffic gradually.
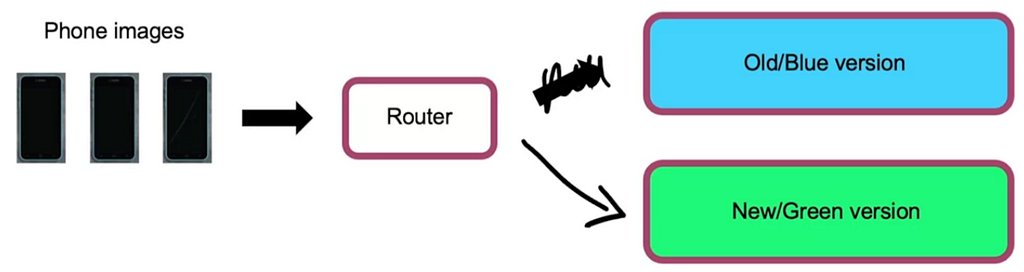
- Another kind of deployment pattern is called the Blue-Green deployment system, where we parallelly use both old versions and the new version of the model and have the router switch from the old version to the latest version. This makes the Rollback very easy.
It is also recommended to consider the deployment in terms of Degrees of Automation. Where the system is gradually changed from
Human only → Shadow mode → AI Assistance for Humans → Partial Automation (Based on the confidence of the model) → Complete Automation
Many applications go through these degrees, and some stop at stages like AI assistance or Partial automation, collectively called Human-in-the-loop systems.
Monitoring an ML system
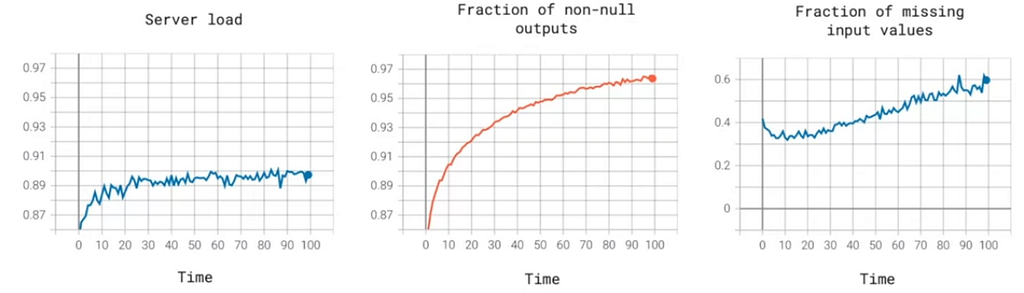
The most common way to monitor systems is to use Monitoring dashboards. Where we have a real-time chart, each with different aspects like server load, a fraction of non-null outputs, a fraction of missing values, etc.,
Deciding what to look into and what to leave alone depends on the project, and the team must brainstorm all the things that could go wrong and give out a few metrics to detect the problems. It is not a problem to use many metrics initially and remove useless ones overtime.
When monitoring, we also set alarms by setting specific thresholds for each metric to immediately take respective measures. These thresholds are not fixed and need to be adapted for each system.
There are 3 major categories into which the metrics are classified generally.
Software Metrics: Metrics that measure the software performance of the service, like,
- Memory used
- Latency
- throughput
- Server load etc.,
Input metrics: Metrics that monitor the inputs given to the service to take note of the changes. Some of them are,
- Avg. input volume
- Avg. input length
- Fraction of input missing values etc.,
Output Metrics: Metrics that monitor the outputs given by the systems, like,
- No. of times null return
- No. of times the user redoes the search
- No. of times that the user switches to a different mode of input to the system to obtain better results.
- Click-through rate (CTR)
⚠️ Note:
– The input and output metrics are mostly application specific.
– Similar to training a model, the deployment and monitoring process is also iterative. We first deploy and set up the monitoring dashboards. We then monitor the performance w.r.t. the users, followed by performance analysis of the system and make relevant changes according to the results.
When a model needs to be updated, it either needs to be retrained manually or automatically. Today in the market, though manual retraining is preferred over automatic retraining, we see many MLOps tools come with sophisticated services that make the entire process easier.
Monitoring a Production Pipeline
Many AI systems are not a single system but rather a pipeline of different systems.
For example, in a simple speech transcription system, we see that the audio is first passed through a VAD module which is inbuilt into the mobile device, which strips the audio only where the speech is detected and gives it to the speech recognition model on the cloud. The model then sends back the transcript of the speech.
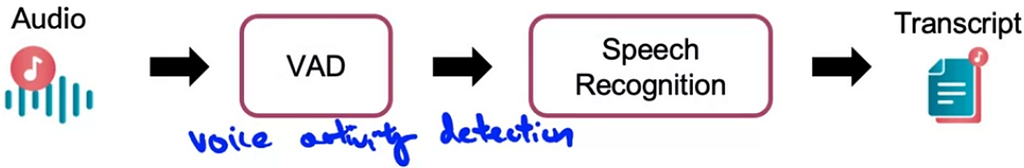
So, the input to the speech recognition system depends on the performance of the VAD module.
Similarly, in a more complex system, the input is passed through different modules, each with its own individual processing methods and tiny losses. These minor errors add up and magnify by the time the result is determined. Hence, we need to make sure that we monitor each and every module independently, along with the result of the entire pipeline.
Metrics to monitor:
For these kinds of different systems, we need metrics to evaluate the performance of these systems. These are also classified into the 3 categories mentioned above, i.e., software metrics, input metrics, and output metrics.
How quickly do these metrics change?
This question is application dependent. For example, in a face recognition pipeline, the faces of people change very gradually, so the metrics don’t change rapidly. However, in another instance of defect detection systems, the metrics change quickly depending on the lighting conditions, time of the day, etc.
This concludes the overview of the deployment portion of the system. Next, we will take one more step back and get an overview of the challenges in developing a model for production. Since I found that the articles are becoming longer, from the next one, I decided to make a single note into meaningful parts so that reading them becomes more straightforward. So stay tuned to the upcoming articles!
In the meantime, if you want to read my notes on CNN, you can read them here, or if you still haven’t read the first part of MLOps notes, you can find it here. You can also look into one of my old data analytics projects on my medium page. Follow me for constant updates on new articles.
MLOps Notes- 2: Deployment Overview was originally published in Towards AI on Medium, where people are continuing the conversation by highlighting and responding to this story.
Join thousands of data leaders on the AI newsletter. It’s free, we don’t spam, and we never share your email address. Keep up to date with the latest work in AI. From research to projects and ideas. If you are building an AI startup, an AI-related product, or a service, we invite you to consider becoming a sponsor.
Published via Towards AI
Towards AI Academy
We Build Enterprise-Grade AI. We'll Teach You to Master It Too.
15 engineers. 100,000+ students. Towards AI Academy teaches what actually survives production.
Start free — no commitment:
→ 6-Day Agentic AI Engineering Email Guide — one practical lesson per day
→ Agents Architecture Cheatsheet — 3 years of architecture decisions in 6 pages
Our courses:
→ AI Engineering Certification — 90+ lessons from project selection to deployed product. The most comprehensive practical LLM course out there.
→ Agent Engineering Course — Hands on with production agent architectures, memory, routing, and eval frameworks — built from real enterprise engagements.
→ AI for Work — Understand, evaluate, and apply AI for complex work tasks.
Note: Article content contains the views of the contributing authors and not Towards AI.
Related posts
Recent Posts


")