Creating Folders
Last Updated on July 26, 2023 by Editorial Team
Author(s): Daksh Trehan
Originally published on Towards AI.
Folders, Groups & Hierarchies: A Road to Tableau Desktop Specialist Certification
Chapter 7: A comprehensive guide to creating folders, groups, and hierarchies in Tableau with included sample questions from the exam

Welcome to the seventh chapter, In this piece, we are going to learn about Folders, Groups, and hierarchies in Tableau.
If you want to navigate through other chapters, visit:
Tableau: What it is? Why it is the best?; A road to Tableau Desktop Specialist Certification.
If you want to directly go on Tableau Desktop Specialist notes, access them here → https://dakshtrehan.notion.site/Tableau-Notes-c13fceda97b94bda940edbf6751cf30
Use the link to get access to free Tableau certification dumps (Valid till 6 July 2022):
Table of Content
- Creating Folders
- Creating Groups
– Creating Groups from Data Pane
– Creating Groups from View - Hierarchies
- Sample Question from this topic
We can group our data either on basis of Data Source or Folders.

Folders are useful options when you have a high load of data and you wish to clear the mess by grouping different fields into folders.
To create a folder, simply choose ‘Group by Folder’ and right-click on any dimension/measure to create a folder.

Folders can be created both for Dimensions as well as Measures.
To add/remove more fields to Folders, simply drag and drop them from Data Pane.

We can also Remove/Rename our folder, by simply right-clicking on the Folder name in Data Pane.

Creating Groups
Groups in Tableau are represented by Paper Clips.

Groups are useful in grouping data that conveys the same meaning but is present with different names. e.g. our Country field contains two rows one for ‘US’ and another for ‘USA’, both depict the same meaning but are adding redundancy to our data, so we will group both of them and give them a single name.
A group lets you combine several members of a single dimension into a single data point or category type, creating a new dimension field that didn’t originally exist in your data.
Grouping can be done on both dimensions & Measures.
We can create a group inside a group.
Grouping can be done in the following ways:
From Data Pane →
Step1: Right Click on Dimension/Measure and choose “Group>>Create”.

Step2: Select all the fields you want to group together and click on “group”.

From Views →
Step1: To create a group from views, choose the required data marks.

Step2: Click on the paper clip icon(Group Members).
While creating groups within the view, the new group field is instantly used in the view.
If we group using labels in the view, a new consolidated mark is created. (if include other is unchecked)
While grouping, we have an option to view other members as “Other” or view them by their labels i.e. we can either add all the other members to the “Others” group or keep them as it is.
When we create a group in marks for the first time(if including others is checked):
- The mark colors are updated in the view.
- A group called “others” is created.
- A group field is created in the data pane.
- A group is selected that combines all selected marks.
Creating Hierarchies
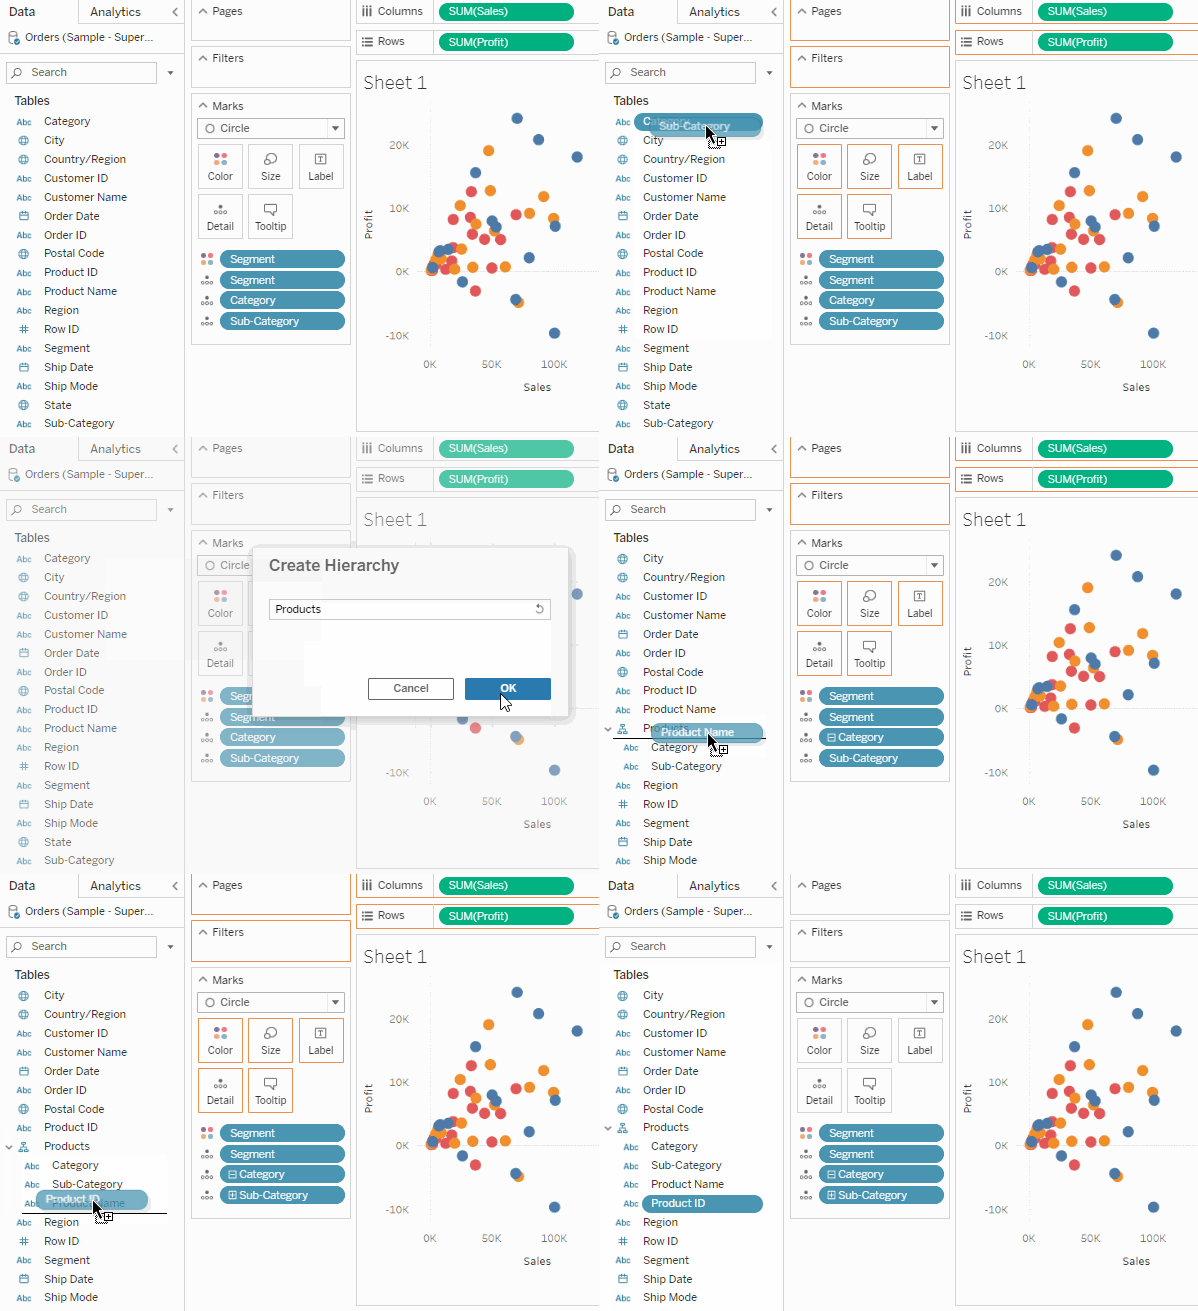
Hierarchies in Tableau are created when we want to denote an “above” and “below” structure. A hierarchy preserves the ordering, creates drilling capabilities in the visualization, and can be used over and over. Any type of data can be organized into a hierarchy.
We can have more than one field to more than one hierarchy.
To create a hierarchy, simply put one field over another.

Hierarchies can be accessed via the “+” or “-” icon on the Row/Column shelf.

Date fields are automatically converted to hierarchy in Tableau.
Sample Questions from this Topic
What are the default hierarchies we can find under dimensions?
a. Region>Country>State>City..
b. Year>Quarter>Month..
c. There are no default hierarchies.
d. Head>Manager>Assistant Manager>..
Solution: Year>Quarter>Month..
Groups combine low-level categories using high-level?
a. True
b. False
Solution: False
Tableau behaves differently when we create groups using labels within the views and using labels in the view?
a. True
b. False
Solution: True
Which of the following is used for data drill-down:
a. date
b. hierarchy
c. group
d. set
Solution: hierarchy
Groups in Tableau are represented by?
a. Paper Clip
b. Double Cylinder
c. Venn Diagram
d. Single Cylinder
Solution: Paper Clip
Use the link to get access to free Tableau certification dumps (Valid till 6 July 2022):
References:
[1] Tableau Help U+007C Tableau Software
[2] Personal Notes
[3]Tableau Desktop Specialist Exam (New Pattern — 2021) — Apisero
Thanks for Reading!
Feel free to give claps so I know how helpful this post was for you, and share it on your social networks, this would be very helpful for me.
If you like this article and want to learn more about Machine Learning, Data Science, Python, BI. Please consider subscribing to my newsletter:
Find me on the Web: www.dakshtrehan.com
Connect with me at LinkedIn: www.linkedin.com/in/dakshtrehan
Read my Tech blogs: www.dakshtrehan.medium.com
Connect with me at Instagram: www.instagram.com/_daksh_trehan_
Want to learn more?
How is YouTube using AI to recommend videos?
Detecting COVID-19 Using Deep Learning
The Inescapable AI Algorithm: TikTok
GPT-3 Explained to a 5-year old.
Tinder+AI: A perfect Matchmaking?
An insider’s guide to Cartoonization using Machine Learning
How Google made “Hum to Search?”
One-line Magical code to perform EDA!
Give me 5-minutes, I’ll give you a DeepFake!
Cheers
Join thousands of data leaders on the AI newsletter. Join over 80,000 subscribers and keep up to date with the latest developments in AI. From research to projects and ideas. If you are building an AI startup, an AI-related product, or a service, we invite you to consider becoming a sponsor.
Published via Towards AI
Take our 90+ lesson From Beginner to Advanced LLM Developer Certification: From choosing a project to deploying a working product this is the most comprehensive and practical LLM course out there!
Towards AI has published Building LLMs for Production—our 470+ page guide to mastering LLMs with practical projects and expert insights!

Discover Your Dream AI Career at Towards AI Jobs
Towards AI has built a jobs board tailored specifically to Machine Learning and Data Science Jobs and Skills. Our software searches for live AI jobs each hour, labels and categorises them and makes them easily searchable. Explore over 40,000 live jobs today with Towards AI Jobs!
Note: Content contains the views of the contributing authors and not Towards AI.


