


Author(s): Luthfi Ramadhan
Statistics
How people use the “Average” term to deceive others
What is Central Tendency?
Central Tendency is a number that describes the middle or typical value of a data. It helps you derive valuable information from data.

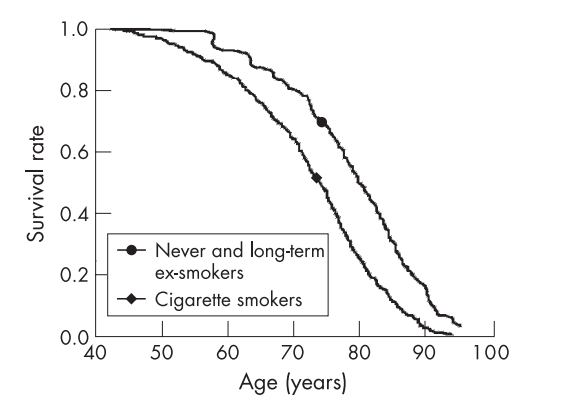
You might quit smoking because, on average, non-smokers have a higher survival rate than smokers.

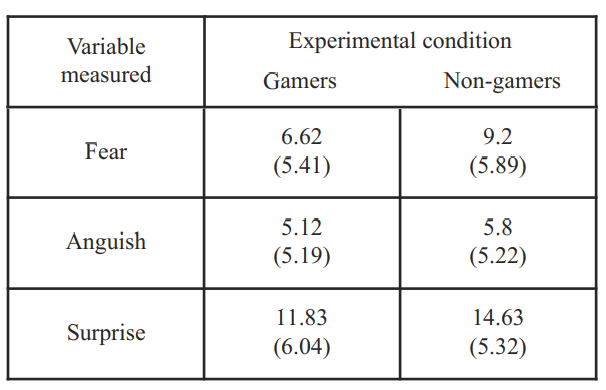
You might want to play some video games because, on average, gamers have a better emotional response than non-gamers.
So, what is this average thing? well, Average is a number about which the data are centered. The average is often known as measures of central tendency. The 3 most common measures of central tendency are mean, median, and mode.
Mean
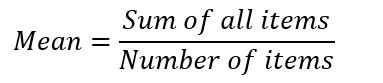
Mean is the most popular and well-known measure of central tendency. Mean is found by adding all items and dividing by the number of items.

Let's say we have data about the price of beverage in a restaurant as follow:

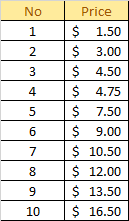
The Mean value will be


So the mean price of the beverage in the restaurant is $8.275. The mean has one main disadvantage which is particularly susceptible to the influence of outliers. Outliers are values that are unusual compared to the rest of the data set by being especially small or large in numerical value. Back to the example above, let's say the restaurant launches its new beverage with a price of $99.00. The price list updated as follow:

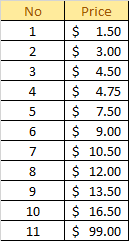
The mean value will be

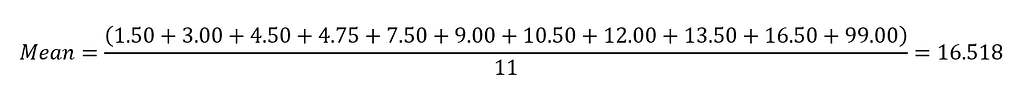
So the mean price of the beverage in the restaurant is $16.518. The problem is when they included their new beverage that charges $99.00 in the price list, this doubled the mean. Isn't it would be biased if we say they sell beverages around $16.518? The point we should take away from this example is that the mean is not enough to make a conclusion.
Median
Median on the other hand is the middle value in an ordered dataset. In order to calculate the median, we have to order our data in ascending order and the median is the value at position (n+1)/2 in the ordered data where n is the number of data. If n is even, the median is the mean between 2 middle numbers. Using the new updated price we can calculate median as follow:
Order data in ascending order


Calculate median position

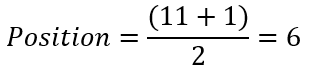
Take the value of data at the obtained position

We get the median value of $9.00. Now we can say that the restaurant sells beverages around $9.00, not really that biased isn't it?
The problem with median is that we have to order the data. In case of large data, it becomes time-consuming to calculate median.
Mode
Mode is the most frequent item in the data. Mode can be used both on qualitative and quantitative data. For example, finding mode on a math score of 10 student

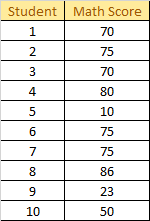
The mode is 75 since it is the most frequent score in the list. We also can use mode in qualitative data, for example finding mode on whether the student passed the test or not
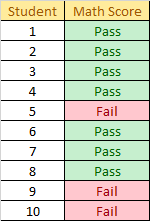
The mode is pass since it is the most frequent score in the list.
Now if we back to the restaurant price list
Well we say that there is no mode since each item’s occurrence is one, but what about we find 11 modes? we can say so but it will be meaningless finding 11 modes out of 11 items.
Skewness
Skewness indicates whether the data is concentrated on one side. If the histogram is shifted to the left or the right side then the distribution is skewed otherwise, it's not skewed. There are two types of skewness namely right (positive) skew and left (negative) skew.

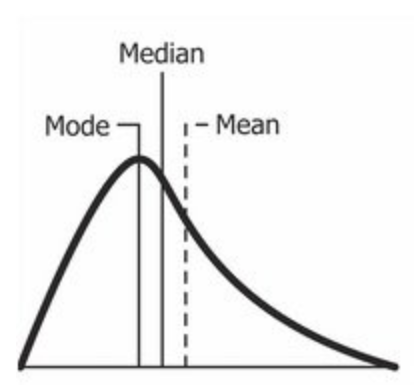
In the right skew case, the 3 measurements will be: mode < median < mean. Right skew tells us that the outliers are located to the right. It means that the outliers are greater than all 3 measurements. For example, in a very hard math examination, someone is very smart that he gets a score of 95 while others get around 50.

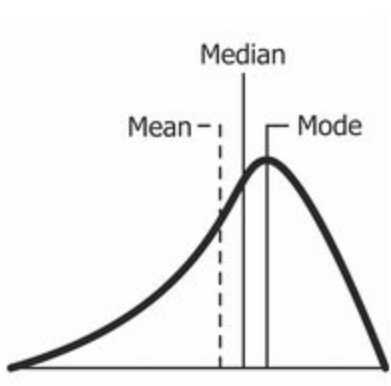
In the left skew case, the 3 measurements will be: mean < median < mode. Right skew tells us that the outliers are located to the left. It means that the outliers are less than all 3 measurements. For example, in a very easy math examination, someone is not very smart that he gets a score of 50 while others get around 95.

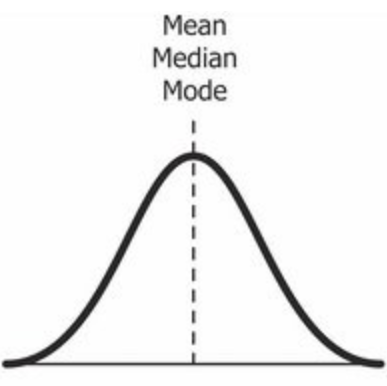
In case of the distribution is not skewed, the mean, median, and mode are agreed on the same value. This is the only condition we can use one measurement.
Conclusion
Which one is the best measurement? the answer is there is no best measurement. If the distribution is skewed whether it's right skew or left skew, using only one measurement is just not enough to tell about the middle of the data, otherwise, if the distribution is not skewed, we can use whatever we want to because all 3 measurements are agreed on the same value.
It is very easy to calculate the central tendency that it is often misused and people frequently use it to deceive others. For example, someone will say “the average of …” and we ended up wondering whether he is talking about the mean, median, or mode.
References
[1] Martinette T Streppel et al., Mortality and life expectancy in relation to long-term cigarette, cigar and pipe smoking: The Zutphen Study (2007)
[2] Erik Geslin et al., Gamers’ versus non-gamers’ emotional response in virtual reality (2011)
[3] Robert S. Witte and John S. Witte, Statistics Eleventh Edition (2016)

Central Tendency: Demystifying “Average” Term was originally published in Towards AI on Medium, where people are continuing the conversation by highlighting and responding to this story.
Published via Towards AI