Logo:
Logo:  Areas Served:
Survival Analysis can be done in excel too.
Last Updated on September 9, 2021 by Editorial Team
Author(s): Supriya Ghosh
Data Analysis
The intention of writing this article is to show you all, “ how Survival Analysis can be done using simple formulas of excel”.
Before I proceed further, let me share a formal definition of Survival analysis.

“Survival analysis is a collection of statistical procedures for data analysis where the outcome variable of interest is time until an event occurs. The survivor function represents the probability that an individual survives from the time of origin to sometime beyond time, t.”
Keeping this definition in mind let us now proceed with our objective of implementing Survival Analysis using excel.
Data set for Analysis
I am considering a simple Case of the Manufacturing Unit where a bunch of old Machines having high chances of breakdown is chosen for Maintenance. Our job is to perform Survival Analysis and find out the probability of Survival of these machines after the end of the Maintenance period.

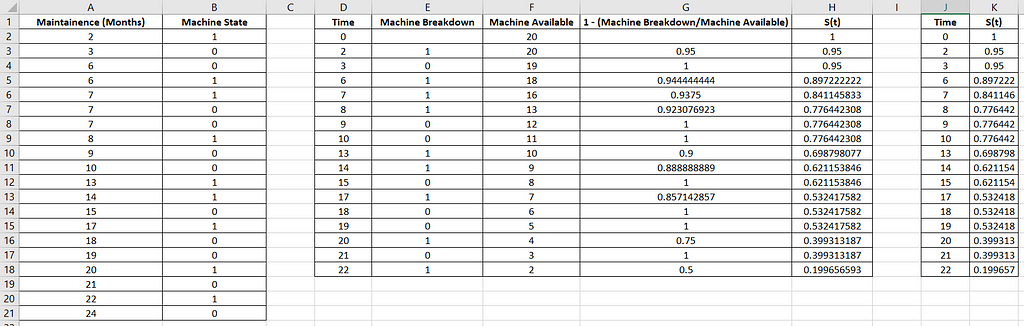
The data set shows how long old machines were under maintenance (column A) and whether machines “broke down or not” after the end of the maintenance period(column B).
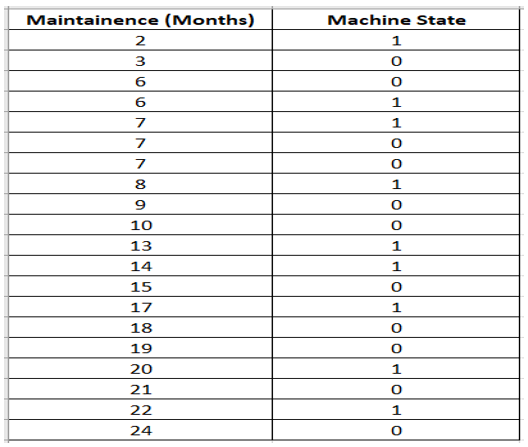
Here 1 = Machine Breakdown and 0 = Machine Available
and total number of Machines included in the population = 20.
Data needs to be modified in order to convert it into the correct format to create a Survival curve.
Formatting the Data
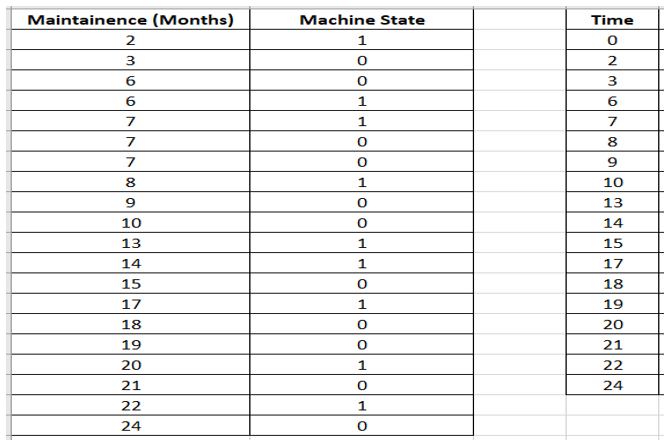
Adding one more column, D as “Time” showing unique Months of Maintenance. The first value should start with 0.
Creating new columns as required
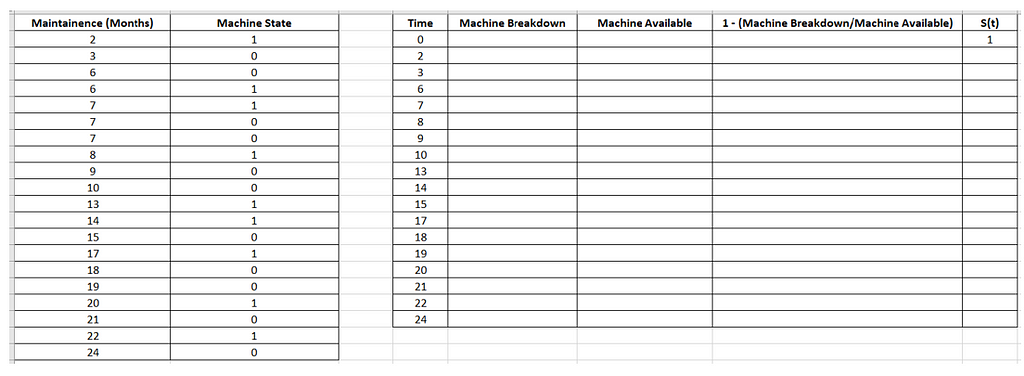
New columns are created as
1. “Machine Breakdown”,
2. “Machine Available”,
3. “1- (Machine Breakdown / Machine Available) “ which is also called as (1 — Hazard) where Hazard = (Machine Breakdown / Machine Available) and
4. “S(t)”(Survival Function).
The values in the column are filled using excel formulas.
The first value in the column, “S(t)” is 1 as at starting time (t = 0) , all Machines are considered to be Available and Working with Survival function as 1.
Filling up individual columns with the required Excel Formulas
1. Starting with the “Machine Breakdown” column.
The first row is kept blank as there was no machine Breakdown at the time instance “0”.
The value in the 2nd row of the “Machine Breakdown” column is calculated using the formula
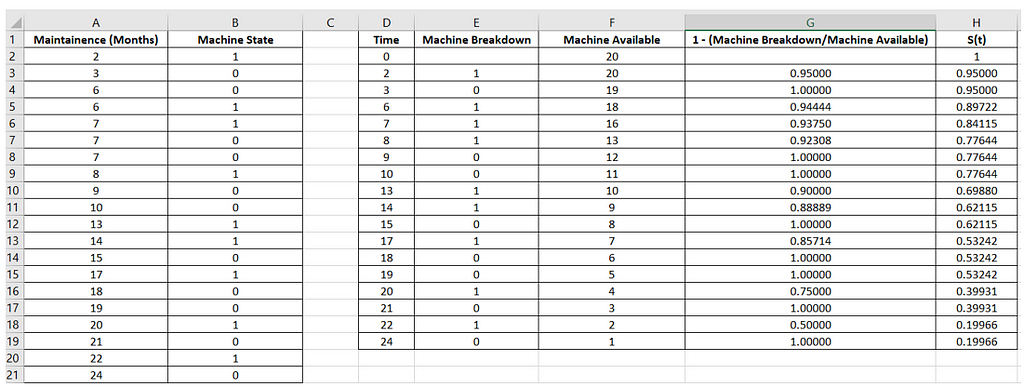
E3: =COUNTIFS($A$2:$A$21,D3,$B$2:$B$21,1)
The other rows of this column are filled by simply highlighting the range E3:E19 and pressing Ctrl-D. Fill in all of the other values in columns F through H using the same trick.
This counts the number of Machines that Brokedown at particular time instances.
2. For the “Machine Available” column, the formula used is :
F2: =COUNTIF($A$2:$A$21, “>”&D2–1)
This counts the number of Machines available at particular time instances after removing the machines which broke down.
3. For calculating the “1 — (Machine Breakdown/Machine Available)” column, the formula used is :
G3: =1-(E3/F3)
It represents Hazard which is given by (Ej/Fj) where j = 1…19
This is computed as it helps in computing the Survival Function, S(t) represented below.

Survival function in Survival Analysis is interpreted as the probability that a certain object of interest will survive beyond a certain time, t. The value of the function lies between 0 and 1(inclusive) and it is a non-increasing function.
4. For the “S(t) column, the formula used is :
H3: =H2*G3
This computes the Survival Probability.
The value in the 1st row of this column is 1, as an instance (t = 0), all machines are available. There is no breakdown.
Now for creating the survival curve, we need to follow certain steps.
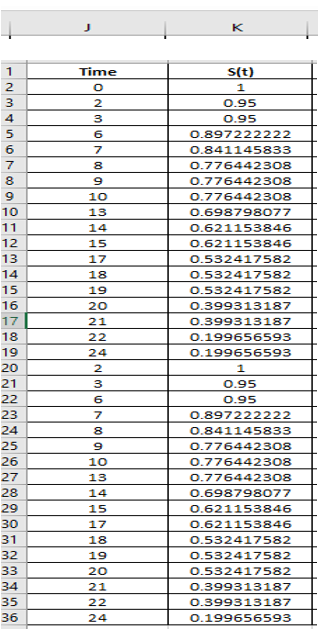
Step 1: Values in columns D and H are copied into columns J and K.
Step 2: Values in the range J3:J19 are copied to J20:J36. And then values in the range K2:K18 are copied to K20:K36.
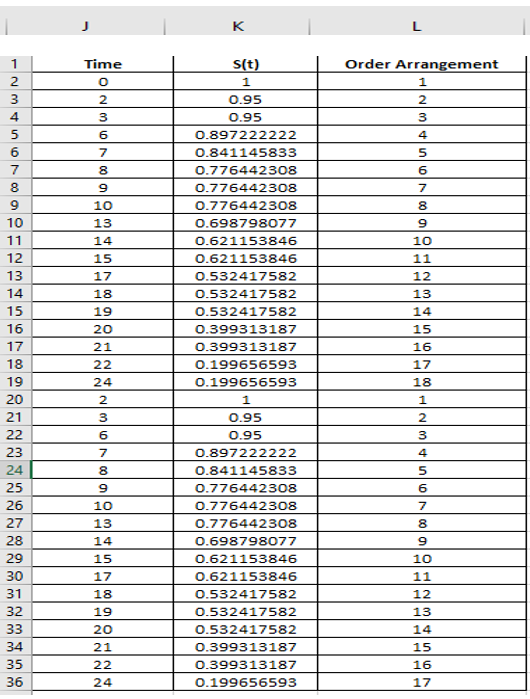
Step 3: The list of values in column L is the sequence of numbers as shown in the below table.
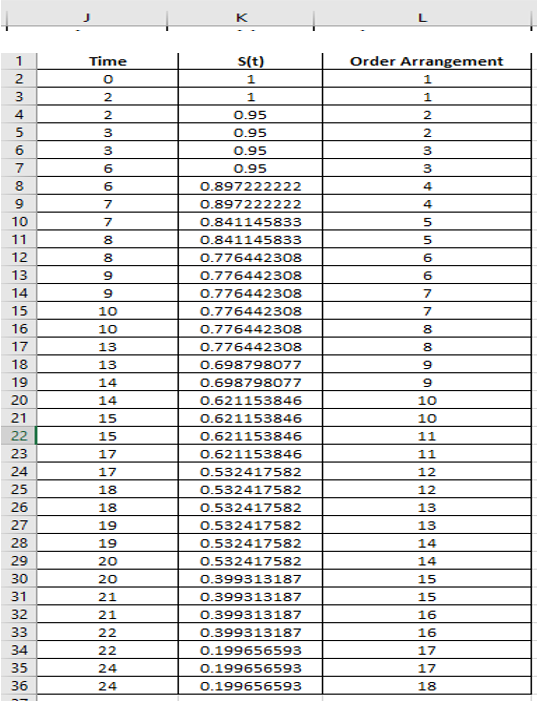
Step 4: Columns J through L are sorted from smallest to largest based on column L.
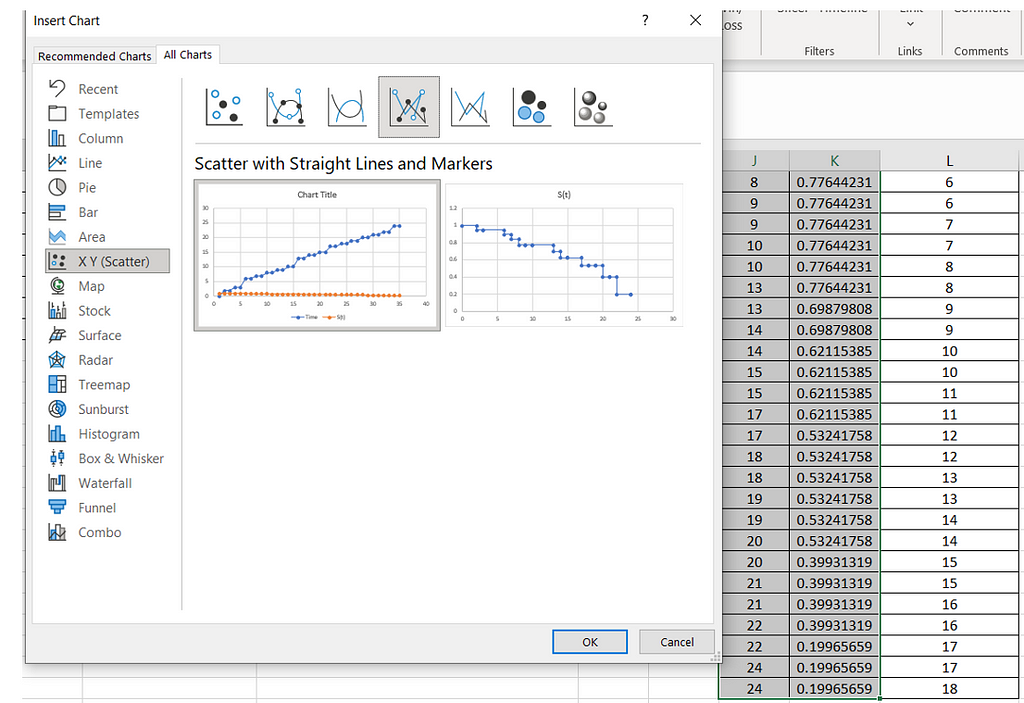
Step 5: Cells J2:K36 are highlighted to create a “Scatter Plot with Straight Lines and Markers” option which is our final Survival Curve (Kaplan-Meier Curve).
Kaplan-Meier is a non-parametric analysis, also known as the product-limit method, used for estimating the survival function based on the time to the occurrence of the event.
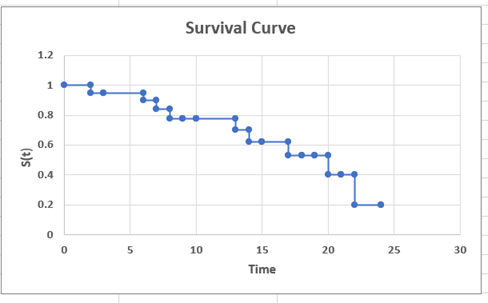
Survival Curve (Kaplan – Meier Curve)
How to interpret this Survival Curve/Kaplan Meier Curve
Kaplan-Meier curve is the visual representation of estimate of Survival function, and it shows what the probability of an event (for example, survival) is at a certain time interval.
From the above Survival Curve, it can be interpreted as :
After a time period of 8 months, the survival probability of machines included in the population is close to 0.80 i.e., 80%.
Similarly, after a time period of 17 months, the survival probability of machines included in the population is close to 0.60 i.e., 60%.
And after a time period of 22 months, the survival probability of machines included in the population is close to 0.20 i.e., 20%.
With this, I conclude.
Hope you enjoyed reading this article.
You can follow me on medium as well as
LinkedIn: Supriya Ghosh
And Twitter: @isupriyaghosh
This will motivate me to be more and more content for you.
Survival Analysis can be done in excel too. was originally published in Towards AI on Medium, where people are continuing the conversation by highlighting and responding to this story.
Published via Towards AI
Related posts

Popular posts

 for 2021")


Updates

Recent Posts