Logo:
Logo:  Areas Served:
Shapash 1.4.2: Grouping your variables for easier understanding of your models
Last Updated on October 11, 2021 by Editorial Team
Author(s): Thomas Bouche
Version 1.4.2 of Shapash is now available and the library has been enriched with a variable grouping feature to take a step forward in the explicability of a variable-rich model!
A model learns from datasets that may contain dozens or hundreds of variables, with variables that have common themes. Grouping these variables into the model explainability makes it easier to understand the model and helps to navigate through the variables and how they influence the model.
With this new version of Shapash, it is now possible to specify a dictionary of groups of variables, which is used in the explainability analysis.
We will illustrate these features on a use case with the public Kaggle dataset: House Prices — Advanced Regression Techniques | Kaggle, (example dataset used in the Shapash tutorials).
This dataset includes about 70 descriptive variables of a house which present information on the aspect and the equipment of the house, the localization, the surfaces of the rooms,… For example, 6 variables describe the garage with the type, the finish, the quality, the surface,… To analyze the explicability of the model, we can group these 6 variables under the same heading “garage”, and have a global vision of this group of variables.
- How to group variables in Shapash?
To have access to the different variable grouping features, you have to declare the variables to be grouped and the name of the group of variables in a dictionary, and to declare this dictionary when compiling Shapash.
features_groups = {
    "location": ["MSZoning", "Neighborhood", "Condition1", Condition2"],
    "garage": ["GarageType","GarageYrBlt","GarageFinish","GarageArea","GarageQual","GarageCond"],
}from shapash.explainer.smart_explainer import SmartExplainer
xpl = SmartExplainer(features_dict=house_dict)
xpl.compile(
    x=X_test,
    model=regressor,
    preprocessing=encoder,
    features_groups=features_groups
)
- How to navigate the Webapp to explore the groups?
To launch the Web app, the code is as follows:
app = xpl.run_app(title_story='House Prices')
In the Web app, this button allows you to activate or deactivate the grouping of variables.
In this feature importance graph, the variables in orange and bold represent the groups of variables. To see the details of each variable in the group, click on the orange bar.
To resume the group of variables, click on the white background of the graph.
When a group is selected in the feature importances graph, the Feature Contribution graph of the group of variables corresponds to a projection on the x-axis using a t-sne dimension reduction. And on the y-axis, we find the sum of the contributions. By pointing the cursor at a point, we find the details of the most contributing variables of the group.
If we click on one of the variables in the group in the feature importances graph, the contribution plot displays the contributions associated with the feature instead of the t-sne projection.
- Local rendering of the grouping of variables :
The grouping of variables also applies to local contributions. It provides a synthetic view of the contributing variables.
In the example presented on the graph, the grouping of variables shows that all the area variables contribute to a price drop of -13,000$ compared to the average. That the location variables (+$3,000) and the garage variables (+$2,000) contribute positively. Moreover, the bars of the hidden contributions are very low (Hidden Positive contributions and Hidden Negative Contributions) with the grouping of variables, which shows that the globality of the contributions is represented.
For local contribution restitution in API or batch mode, the groups of variables are integrated into the Smartexplainer (method to_pandas) and Smartpredictor (method summarize) objects. They can be deactivated with the “use_groups=False” option.
predictor = xpl.to_smartpredictor()
predictor.add_input(sample_input)
predictor.summarize()
For groups of variables, the value is a dictionary of all the values of the variables in the group.
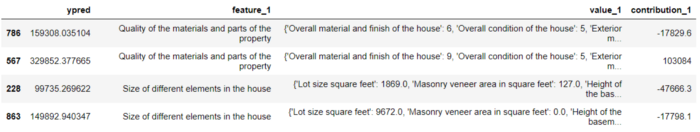
For each individual, the Smartpredictor’s summarize() method provides a DataFrame that contains the variables sorted by importance in the contribution. In the above examples, the main contributing variables are grouped variables, which makes it easier to summarize the prediction.
With these new features, we hope that Shapash can further facilitate the understanding of a machine learning model.
For more details, we invite you to discover the tutorial on the Shapash GitHub.
💡Share your ideas!
Feel free to visit Shapash GitHub: you’ll find exhaustive documentation about this new feature. You can also leave your messages there (discussions tab) and contribute to the solution by sharing your templates or any other idea. May Shapash contribute to the development of a trustworthy AI!
Machine Learning was originally published in Towards AI on Medium, where people are continuing the conversation by highlighting and responding to this story.
Published via Towards AI
Related posts
Popular posts

 for 2021")


Updates

Recent Posts