


Author(s): Raja Dev
Data Science
A practical guide to instant documentation

Systems read files but Humans read documents. The more stories we document, the more collaborative analysis would be.
Dataframes are the key structures of analysis. They hold the critical data supporting key decision makings, at several stages, in the process of solving a problem. Often, decision-making involves multiple stakeholders who need to look at the data held in these data frames.
As a good data scientist and a programmer, we should not be bombarding the decision-making panel with the screens of our debugging environment. Instead, we should render the critical data in a way that is more intuitive for people to look at and understand.
This article is for experienced data scientists who prefer to explain their analysis as storytelling to business rather than a chain of buzz words.
Rendering is as important in building a human interface to the application as Serialization in building a system interface. Pandas Dataframe supports the following three most popular languages of online & offline documentation.
- HTML
- LaTeX and
- Markdown
The decision-making panel can see the data frame values translated to their native document environment, without requiring any environment shift.
Let’s go through an example and see how to render the data frame into each of these formats and how does the output looks like in their respective document viewers.
Initialize DataFrame
Import pandas and initialize data frame with example values.
import pandas as pd
df = pd.DataFrame({
"Manufacturer":['Subaru', 'Mitsubishi', 'Mitsubishi', 'Suzuki','Nissan'],
"Model": ['Impreza','Lancer','Lancer','Ignis','Almera'],
"Color": ['blue','silver','white','red','black'],
"engine_capacity": [2,1.5,1.8,1.3,1.6],
"price": [10950,6950,576,3800,7850]})
[Dataset Referred: https://www.kaggle.com/lepchenkov/usedcarscatalog]
1. HTML Rendering
i) Run to_html() method of Dataframe.
htmlCode = df.to_html()
ii) The method generates the following HTML code
<table border="1" class="dataframe">
  <thead>
    <tr style="text-align: right;">
      <th></th>
      <th>Manufacturer</th>
      <th>Model</th>
      <th>Color</th>
      <th>engine_capacity</th>
      <th>price</th>
    </tr>
  </thead>
  <tbody>
    <tr>
      <th>0</th>
      <td>Subaru</td>
      <td>Impreza</td>
      <td>blue</td>
      <td>2.0</td>
      <td>10950</td>
    </tr>
    <tr>
      <th>1</th>
      <td>Mitsubishi</td>
      <td>Lancer</td>
      <td>silver</td>
      <td>1.5</td>
      <td>6950</td>
    </tr>
    <tr>
      <th>2</th>
      <td>Mitsubishi</td>
      <td>Lancer</td>
      <td>white</td>
      <td>1.8</td>
      <td>576</td>
    </tr>
    <tr>
      <th>3</th>
      <td>Suzuki</td>
      <td>Ignis</td>
      <td>red</td>
      <td>1.3</td>
      <td>3800</td>
    </tr>
    <tr>
      <th>4</th>
      <td>Nissan</td>
      <td>Almera</td>
      <td>black</td>
      <td>1.6</td>
      <td>7850</td>
    </tr>
  </tbody>
</table>
iii) Write this output to a file.
file = open("output/df.html","w")
file.write(htmlCode)
file.close()
iv) Open output/df.html file in a web browser.

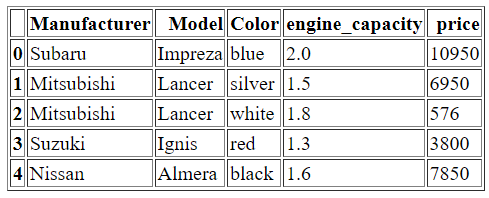
v) To make it more intuitive to the readers, you can further add style to the HTML table
styler = df.style
styler = styler.background_gradient()
htmlCodeWithStyle = styler.to_html()
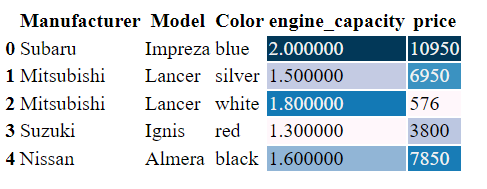
vi) It generates the HTML code along with style information.
<style type="text/css">
#T_775bd_row0_col3, #T_775bd_row0_col4 {
background-color: #023858;
color: #f1f1f1;
}
....
</style>
<table id="T_775bd_">
<thead>
<tr>
<th class="blank level0" > </th>
<th class="col_heading level0 col0" >Manufacturer</th>
...
</tr>
</thead>
<tbody>
...
</tbody>
</table>
vii) Write this HTML Code to another file
file = open("output/df2.html","w")
file.write(htmlCodeWithStyle)
file.close()
viii) You should be seeing the following table in your web browser

2. LaTeX Rendering
i) Run to_latex() method of Dataframe.
latexCode = df.to_latex()
ii) It generates the following latex code.
\begin{tabular}{llllrr}
\toprule
{} & Manufacturer &    Model &   Color &  engine\_capacity &  price \\
\midrule
0 &       Subaru &  Impreza &    blue &              2.0 &  10950 \\
1 &   Mitsubishi &   Lancer &  silver &              1.5 &   6950 \\
2 &   Mitsubishi &   Lancer &   white &              1.8 &    576 \\
3 &       Suzuki &    Ignis &     red &              1.3 &   3800 \\
4 &       Nissan &   Almera &   black &              1.6 &   7850 \\
\bottomrule
\end{tabular}
iii) Write this output to a latex file
file = open("output/df.tex","w")
file.write(latexCode)
file.close()
iv) Open df.tex in your LaTeX viewer and see the output image.

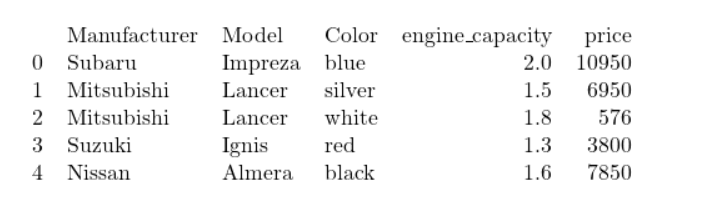
If you do not have a local viewer at the moment, you can use some online viewers like https://quicklatex.com/
3. Markdown Rendering
i) Run to_markdown() method of DataFrame
mdCode = df.to_markdown()
ii) It generates the following markdown code
|    | Manufacturer   | Model   | Color   |   engine_capacity |   price |
|---:|:---------------|:--------|:--------|------------------:|--------:|
|  0 | Subaru         | Impreza | blue    |               2   |   10950 |
|  1 | Mitsubishi     | Lancer  | silver  |               1.5 |    6950 |
|  2 | Mitsubishi     | Lancer  | white   |               1.8 |     576 |
|  3 | Suzuki         | Ignis   | red     |               1.3 |    3800 |
|  4 | Nissan         | Almera  | black   |               1.6 |    7850 |
iii) Write this code to an md file.
file = open("output/df.md","w")
file.write(mdCode)
file.close()
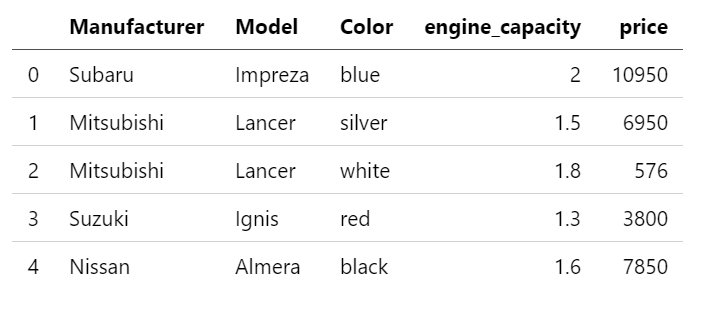
iv) Open this markdown file in your favorite viewer. I used Visual Studio Code.

Conclusion
DataFrames are critical in supporting key decisions related to the process of analysis. Rendering is very important in making these decisions more collaborative among the stakeholders. Pandas DataFrame supports rendering into the three most popular documentation languages — HTML, LaTeX, and Markdown. We did a rendering exercise with an example, covering all these formats. That’s it! We are now ready to tell instant, informative and interesting stories to the business about our data analysis.

3 Ways to Render Pandas DataFrames was originally published in Towards AI on Medium, where people are continuing the conversation by highlighting and responding to this story.
Published via Towards AI