Logo:
Logo:  Areas Served:
Naive-Bayes Inference for Testing
Last Updated on October 23, 2020 by Editorial Team
Author(s): Lawrence Alaso Krukrubo
Data Science
Proof that Testing Accuracy is Simply Not Enough…
Intro:
Probability is the cornerstone of Artificial Intelligence. The management of uncertainty is key to many applications of AI, such as machine learning, filtering, robotics, computer vision, NLP, search and so on.
Probability is the machinery through which we manage uncertainties…
And no other sector is the management of uncertainty as crucial as it is in the health sector.
- Imagine being allergic to a specific drug, but an allergy test falsely indicates you're nonallergic (false negative).
- Or imagine feeling sick and tested for HIV, only to be found positive, while you actually don’t have HIV (false positive).
At first glance, the false-negative seems more devastating. Of course, a false allergy test-result has the likely outcome of a GP administering a drug to you that could cause life-threatening issues.
But so is the false-positive case. A person could become suicidal after a false-positive HIV test. He/She would be prevented from being a blood-donor if a member of their family had an emergency and in critical need of their blood type. Add these to the mental and emotional torture and despair.
When it comes to health, false-positives and false-negatives are equally harmful…
Reverend Thomas Bayes, an 18th-century Mathematician and Presbyterian Minister invented the Bayes-Rule, which is often referred to as the Holy-Grail of probabilistic inference, due to its binding on marginal, joint, conditional and total probabilities.
In short, Bayes Theorem calculates the probability (P)of a certain event happening (such as is this message spam?) based on the joint probabilistic distributions of certain other events.
Naive-Bayes is so-called because it naively assumes that events are independent. This is a false and naive assumption, but in practice, it works very well and makes the Naive-Bayes algorithm efficient.
Naive-Bayes Application:
Let’s look at a real-life example of using Naive-Bayes theorem to derive crucial, inferences from medical tests.

Let’s say you’re a Master’s student in London, it’s Friday after classes, you’re home trying to take a break over a drink with your roommate, John.
You observe John is visibly sad and disturbed, so after a few minutes of prodding he opens up to you that he’s just tested positive for HIV.
This is devastating! So you ask John if he did a follow-up test and he says:
“No, it’s the best lab in town, their test-kits use the latest software with 99% consistent accuracy over the past 5 years.”
You feel sorry for John and then based on your knowledge of data, you decide to do a little digging.
- You discover the UK has an HIV rate of 1.7 per 1000 people.
- You also confirm on the lab’s website that the test kit has an accuracy of 99%, stating that in every sample of 100 infected HIV patients, the test classifies 99 as positive. The reverse holds in samples of 100 negative people, it accurately classifies 99 as negative. In both cases, it misclassifies just 1 patient.
It’s beginning to dawn on you that John may really have HIV, but then you remember Bayes Rule and you open up your Jupyter Notebook…
Chance or Logic?
Okay, so you’re about writing down the details of this case… What facts do you have so far? Luckily you remember one of the axioms of probability which states that:
The probability (P) of mutually exclusive events must be equal to 1. .
If P of getting heads for a fair coin is 0.5, then P of getting tails must be 1–0.5 = 0.5. We call this the complement rule (CR). This is highly non-trivial and powerful.
So you start writing your facts down…
- The P of testing positive given one has HIV is 99%
p_pos_given_hiv = 0.99
- Therefore, its complement must be 1–0.99, based on (CR)
p_neg_given_hiv = 1 - 0.99
- Next, the P of testing negative given No-HIV is also 99%
p_neg_given_no_hiv = 0.99
- Again, its complement must be 1–0.99, based on (CR)
p_pos_given_no_hiv = 1 - 0.99
- Next, the P of HIV is 1.7/1000 = 0.0017
p_hiv = 0.0017
- Again, its complement must be 1–0.0017, based on (CR)
p_no_hiv = 1 - 0.0017
So you seem to be doing good thus far, but wait! You need to remind yourself of the formula for Bayes-Rule again…
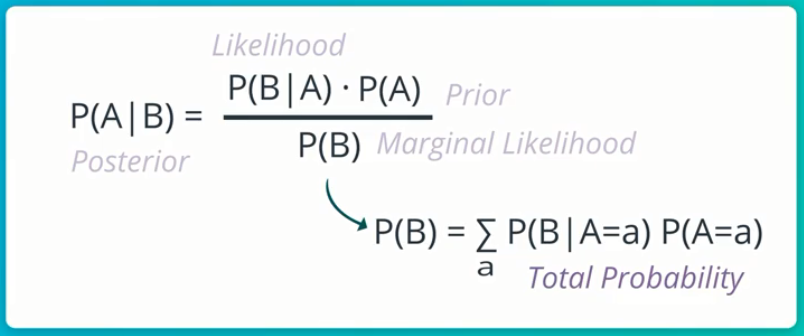
This simply means that the Conditional P of event A, given event B is the Conditional P of event B, given event A, multiplied by the Marginal P of event A, all these divided by the Marginal P of event B (which is actually the Total P of event B occurring at all).
It’s quite a mouth-full, but it’s really intuitive…
Note that:
- P(A|B): Is called the Posterior, this is what we want to compute given some evidence.
- P(B|A): Is called the Likelihood. This is some conditional P that we know. In this case, it’s the conditional P of testing positive given HIV, which we know is 99%.
- P(A): Is called the Prior, it’s the evidence we sorta stumble upon after realizing the likelihood. In this case, it’s the p_hiv, which is 0.0017.
- P(B): Is called the Marginal Likelihood, AKA Total Probability, AKA Normalizer. This is usually the more difficult aspect of Bayes-Rule to compute.
Alright, so what do we do now? We have John’s positive test result. We also know the conditional P of John testing positive to HIV, given that the test says he has HIV is 99%.
p_pos_given_hiv = 0.99
But thank goodness! With Bayes-Rule, we can find out what exactly is the probability or chance of John actually having HIV, given that his test result is positive?
p_hiv_given_pos = ??
This new conditional P we seek is the Posterior…
You see that with Bayes-Rule, we can go from what we know (p_pos_given_hiv = 0.99) to what we infer from available data and evidence (p_hiv_given_pos = ??).
This inference is the conditional P of John actually having HIV, given that we know he’s tested positive.
Calculating Posterior:
Now, we simply use Bayes-Rule and plug in our variables.
# Bayes_Rule
p_hiv_given_pos = (p_pos_given_hiv * p_hiv) / p_pos
It’s ideal to compute the numerator first… p_pos_given_hiv times p_hiv.
numerator = p_pos_given_hiv * p_hiv
>>
# numerator = 0.0017
Now to compute the denominator, AKA Normalizer… p_pos.
It gets a bit tricky here, the Normalizer is computed via Total P. This is (p_pos_given_hiv * p_hiv) +(p_pos_given_no_hiv * p_no_hiv).
denominator =
(p_pos_given_hiv * p_hiv)+(p_pos_given_no_hiv * p_no_hiv)
>>
# denominator = 0.0117
Now that we have the numerator and denominator, we divide the former by the latter to get the posterior.
posterior = numerator / denominator
posterior = 0.0017 / 0.0117
>>
# posterior = 0.1452
Hold on! Do you really understand what just happened?
Bayes Rule has shown that, given a positive test result for John, via a state-of-the-art test kit with 99% accuracy… John only has a 14.5% chance of having HIV. Meaning he has 85.5% chance of actually not having HIV!

This is unbelievably insane! you’re literarily weaving Celtic-knots in your brain right now, trying to process what-the–flipping-joy, you just inferred from the data…
You cross-check the calculations, everything’s fine, so you excitedly announce to John that he has 85.5% chance of being negative despite the existing Likelihood.
He looks you dead in the eyes and says,
Hey Dude… This is not the time for some fancy untested algorithm you’re just checking out, this is about my life! How did we go from 99% positive test accuracy to 85.5% no chance of HIV?
The Proof:

We know from current statistics about The UK that the rate of HIV is 1.7 per 1000 people, which is 0.0017.
Let’s assume we have a population of one million people in the UK.
uk_pop = 1000000
Now, for these 1 million people, they can either be positive or negative to HIV. Let’s represent these in two complementing groups…
hiv = 1.7 * 1000 * 1000
no_hiv = uk_pop - hiv
>>
hiv = 1,700
no_hiv = 998,300
Recall that for every 100 cases, 99 gets correctly classified and 1 misclassified. This applies to both the hiv and no_hiv groups.
At this point, let’s define some important terms from the Confusion-matrix.
Check out this article I wrote extensively about the Confusion-matrix if you need a refresher.
- False-Positive: This is when a test says a person is positive, but it's false as the person is truly negative.
- False-Negative: This is when a test says a person is negative, but it's false as the person is truly positive.
- True-Positive: This is when a test says a person is positive and it’s true.
- True-Negative: This is when a test says a person is negative and it’s true.
So taking the hiv group first, let’s compute those truly-positive(99%) and falsely-negative(1%).
true_positive_hiv_group = (99/100) * hiv
false_negative_hiv_group = (1/100) * hiv
>>
true_positive_hiv_group = 1,683
false_negative_hiv_group = 17
We repeat for the no_hiv group, computing those truly-negative(99%) and falsely-positive(1%)
true_negative_no_hiv_group = (99/100) * no_hiv
false_positive_no_hiv_group = no_hiv - true_negative_no_hiv_group
>>
true_negative_no_hiv_group = 988,317
false_positive_no_hiv_group = 9,983
So we have four distinct groups here…
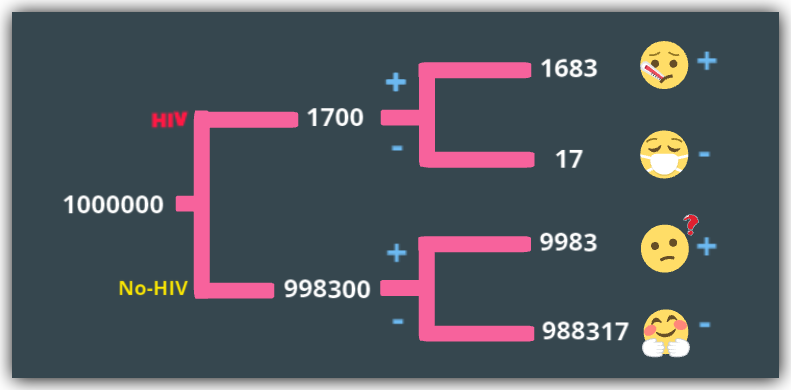
- true_positive_hiv_group: 1,683 people who have HIV and correctly classified as positive, ideally given drugs and care.
- false_negative_hiv_group: 17 people who have HIV, but sent home on the false evidence that they don’t have HIV.
- true_negative_no_hiv_group: 988,317 UK residents who don’t have HIV and sent home on the true evidence of no HIV.
- false_positive_no_hiv_group: 9,983 people who are the confused and traumatized patients who don’t have HIV but diagnosed with HIV and sent for more tests and attendant care. Despite having being tested with a test-kit 99% accurate.
So back to John’s test result… How is his chance of not having HIV 85.5% given he tested positive?
We know that since he tested positive, then he must be in either of the positive sets. This means he must be in either true_positive_hiv_group or false_positive_no_hiv_group.
So what are his chances?
total_positives = true_positive_hiv_group + false_positive_no_hiv_group
>>
total_positives = 11,666
So John’s chance of truly being HIV positive after testing positive is…
p_john_true_pos = true_positive_hiv_group / total_positives = 0.1443
~14% chance only!
p_john_false_pos = false_positive_no_hiv_group / total_positives
p_john_false_pos =  0.8557
And John has 85.5% chance of falsely being positive to HIV.
More Inference:

The above experiment would always be true because even though the test only fails 1% of the time, that 1% is much larger than the 0.017% HIV rate per 1000 of the UK population.
Therefore in a sample of 1 million people in the UK, ~10,000 will be diagnosed with HIV, while only ~1,700 do have HIV, going by this test with 99% accuracy.
Possible Solution:
When it comes to any form of classification tasks, whether binary or multi-class classification, a much better metric to use is the Confusion matrix and its suite of metrics such as Recall, Precision, True-Negative-Rate (TNR), false-Positive-Rate, F1-Score and AUC. Accuracy alone is unreliable.
Let’s see these quickly, given all the evidence we know about the test-kit and HIV prevalence in the Uk, if we took a sample of 1 million people, we would have the following:
- Accuracy = 99%
- Recall/TPR/Sensitivity = 99%
- Precision = 14.4%
- TNR/Specificity = 99%
- FPR = 1%
But we would have a terrible F1-Score which is the harmonic weighted mean of Recall and Precision.
f1_score  = 2 * ((precision * recall) / (precision + recall))
>>
f1_score = 0.2519
With an F1-Score of 0.25 out of 1, this test kit is over-all inefficient.
It’s not useless though, because, with 99% TPR and TNR rates, it’s done really well at identifying total positive and negative cases. But it does so at a cost.
And this cost is the Precision (14.4%) and FPR (1%), we see above.
If all the over 67 million people in the UK, took this very HIV Test, with 99% accuracy, there’d be over 670,000 people wrongly classified as HIV-positive, who don’t have HIV. This would be a nightmare on a national scale.
So the solution here is not a single step, but it involves a careful balance of the Precision / Recall Trade-off.
Simply put, if the target is to classify all HIV cases at all times, we seem to be in a good place with 99% accuracy. But we must find a way to reduce the number of negative people that are incorrectly classified as positive.
This Trade-off is a careful balance that a seasoned Data Professional can handle with some iterative testing, better balancing of the dataset and activities that can make a model slightly less sensitive to the HIV class.
Summary:

John gets brightened, he smiles slightly, takes a sip of his drink and says:
So what next? I’d go do a second test, but what are my final chances?
So you say…
Dear John, given the evidence of a positive test result, your chance of testing positive again has increased , but over-all your chance of not having HIV remains the same, given only the evidence of the first test.
And you go ahead to show john his new increased chance of testing positive again based on the evidence of his first test. This is called a Conditional-Probability.
This is the beauty of Naive-Bayes rule, every evidence is considered as we make inferences.
John’s new P for testing positive again is the Total P of testing positive conditioned on the fact that his first test was positive and exploiting the conditional independence of Test1 and Test2 being positive, given HIV and No-HIV.
It’s no trivial computation. I suggest you see my notebook for the intuition.
Finally:
You let John know his new chances
- P of the second test positive given the first test positive = 15.2% (increased slightly from 14.5%)
- P of not having HIV given the first test is still 85.5% (because no evidence of any other test as at now)
One week later, John takes a second test and is Negative, he tests Negative again after 3 months.
See the Notebook for this article here
Credit:
Thanks to Sebastian Thrun(Founder of Udacity) for his awesome and challenging teachings on Probability and Statistics. I am a Proud Artificial Intelligence Nanodegree Recipient… Learning Continues!
About Me:
Lawrence is a Data Specialist at Tech Layer, passionate about fair and explainable AI and Data Science. I believe that sharing knowledge and experiences is the best way to learn. I hold both the Data Science Professional and Advanced Data Science Professional certifications from IBM and the IBM Data Science Explainability badge. I have conducted several projects using ML and DL libraries, I love to code up my functions as much as possible. Finally, I never stop learning and experimenting and yes, I have written several highly recommended articles.
Feel free to find me on:-
Naive-Bayes Inference for Testing was originally published in Towards AI on Medium, where people are continuing the conversation by highlighting and responding to this story.
Published via Towards AI
Related posts


Popular posts

 for 2021")


Updates

Recent Posts