Logo:
Logo:  Areas Served:
Lyft Motion Prediction for Autonomous Vehicles: 2020
Last Updated on July 24, 2023 by Editorial Team
Author(s): Rashmi Margani
Lyft Motion Prediction for Autonomous Vehicles: 2020
Lyft motion prediction challenge for self-driving cars
Problem Description
The challenge is to predict the movement of traffic agents around the AV, such as cars, cyclists, and pedestrians for 2020. At the same time, the 2019 competition focused on detecting the 3D objects, an important step prior to detecting their movement. Overall this requires quite a unique domain skill comparative to the 2019 problem statement.
The dataset consists of 170,000 scenes capturing the environment around the autonomous vehicle. Each scene encodes the state of the vehicle’s surroundings at a given point in time.
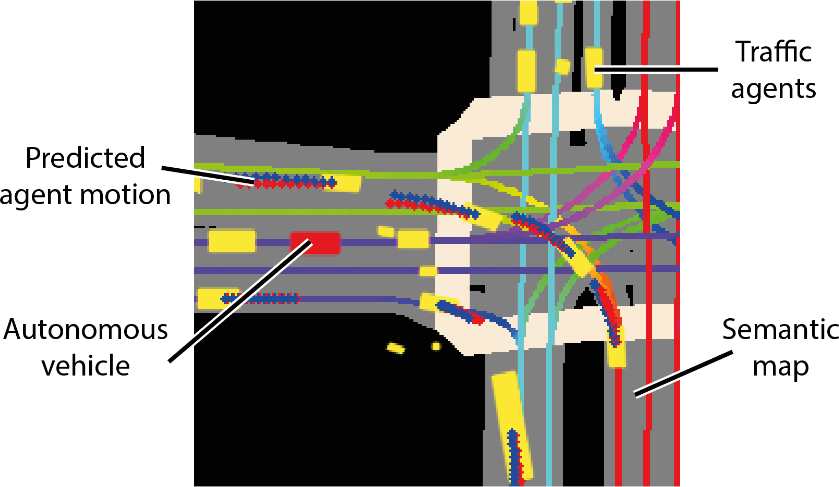
The goal of this competition is to predict other cars/cyclist/pedestrian (called “agent”)’s motion.
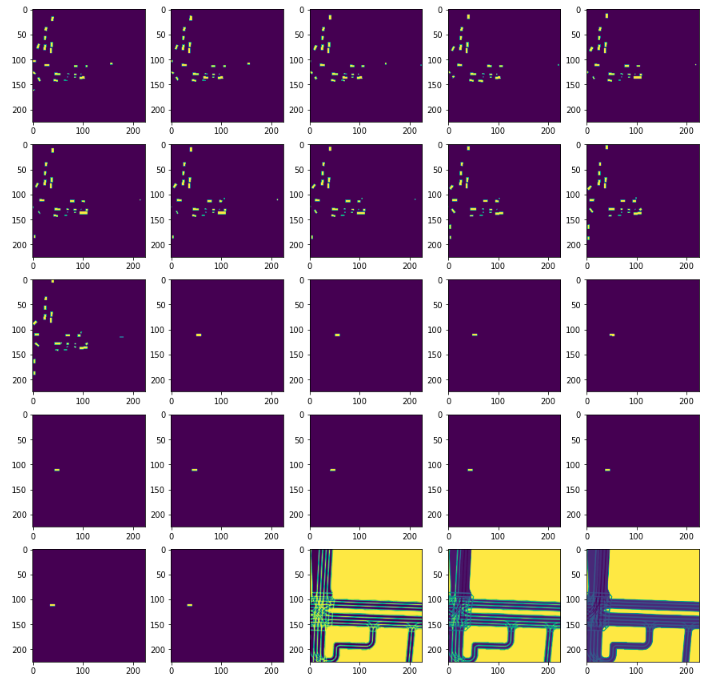
The data preprocessing technique called rasterization is a process of creating images from other objects. For example, below is a typical image that we get, with 25 channels, channel by channel view. First, 11 images are rasterizations of other agent’s history, the next 11 images are the agent under consideration itself, and the last 3 are semantic map rasterization.
And converting to RGB image using rasterizer includes:
- image: (channel, height, width) image of a frame. This is Birds-eye-view (BEV) representation.
- target_positions: (n_frames, 2) displacements in meters in world coordinates
- target_yaws: (n_frames, 1)
- centroid: (2) center position x&y.
- world_to_image: (3, 3) 3×3 matrix, used for transform matrix.
Example of L5Kit(Lyft 5 kit) structure for data processing:
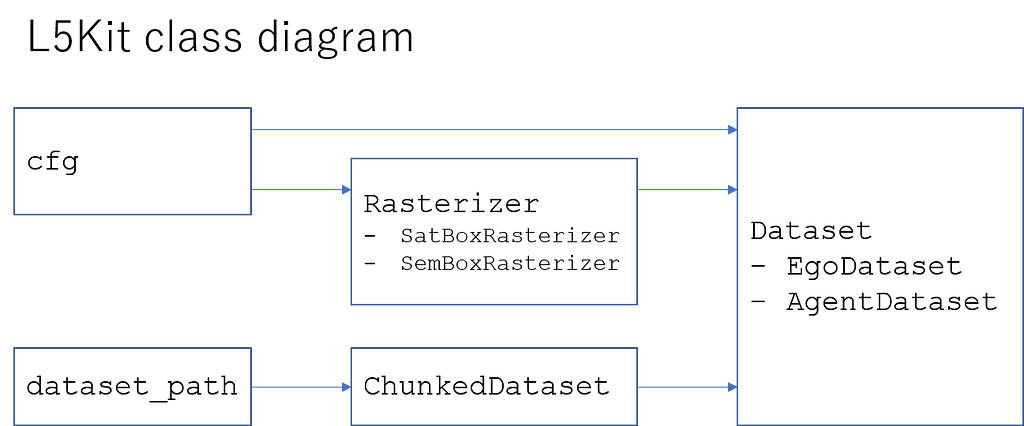
Having said that, in this competition, understanding the Rasterizer class and implementing the customized rasterizer class has been a big challenge. Hence here is how to select the two important configuration options. We should carefully consider the
- raster_size The rasterized image final size in pixels (e.g.: [300, 300]
- pixel_size Raster’s spatial resolution [meters per pixel]: the size in real-world one pixel corresponds to.
Raster sizes
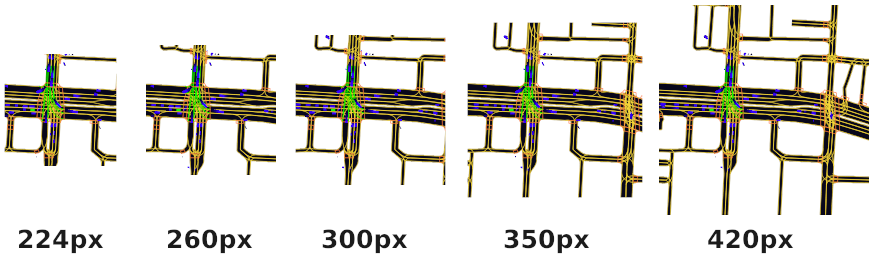
pixel_size = [0.5, 0.5]
As you can see in the image, if you increase the raster size (pixel size is constant), the model (ego/agent) will “see” more areas surrounding.
- More area behind/ahead
- Slower rendering, because of the more information (agents, roads, etc.)
What is a good raster size?
I think it depends on the vehicle’s velocity.
km/h ms/Distance in 5 sec pixels10.281.392.7851.396.9413.89102.7813.8927.78154.1720.8341.67205.5627.7855.56256.9434.7269.44308.3341.6783.33359.7248.6197.224011.1155.56111.115013.8969.44138.896016.6783.33166.67
Let’s say If I used it constantly pixel_size = [0.5, 0.5] for these calculations.
The question is, what is the average velocity. In the image below, you can see the average speeds. (I assume that the unit is meter/seconds). I exclude everything with less than 1 m/s. Based on this information, we can select the size of the image.
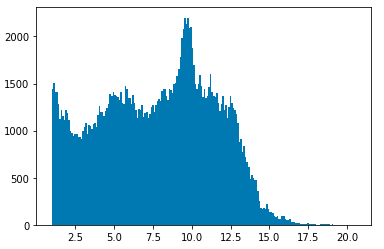
- Pick your maximum speed. For example, 20 m/s
- Calculate the maximum distance in 5 seconds. (100 meters)
- Divide it by the size of the pixels (100 / 0.5 = 200)
- Because the ego is at raster_size * 0.25 pixels from the left side of the image, we have to add some space. The final size is 200/0.75 = 267
Pixel sizes
The other parameter is the size of the pixels. What is one pixel in terms of world-meters? In the default settings, it is 1px = 0.5m
In the image below, you can see the differences between different pixel sizes. (The size of the images is 300x300px). Because, for example, the pedestrians are less the half meter (from the above view), they are not visible in the first 2–3 images. So we have to select a higher resolution (lower pixel_size). Somewhere between 0.1 and 0.25.
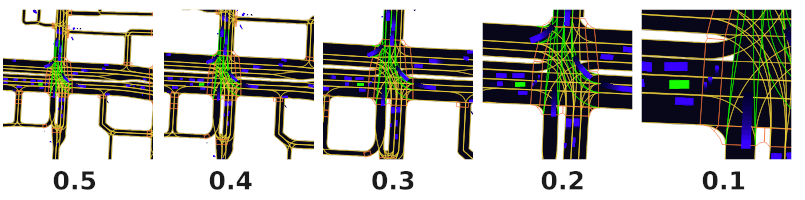
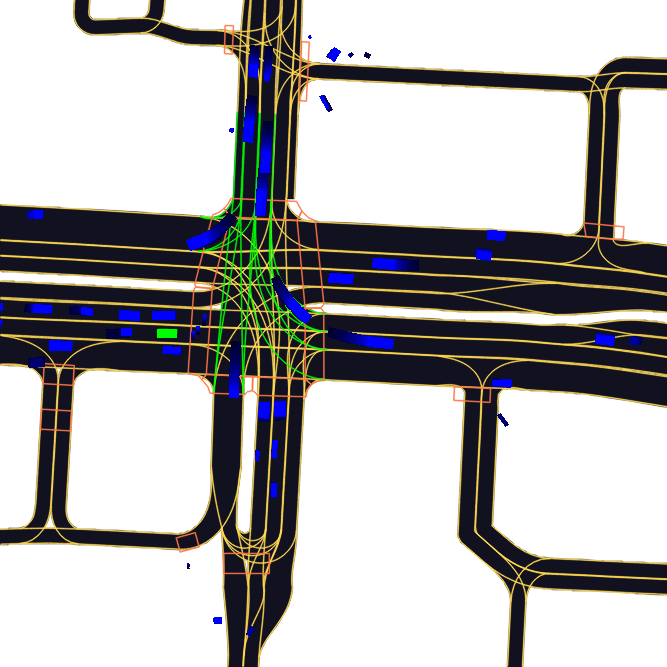
If we use a different pixel size, we have to recalculate the image size as well. Recalculate the example above with pixel_size=0.2:
- 20 m/s
- 100 meters in 5 seconds
- 100/0.2 = 500
- final image size: 500/0.75 = 667px
Problems
As we increase the image_size and the resolution (decreasing the pixel size), the rasterizer has to work more. It is already a bottleneck, so we have to balance between the model performance and training time.
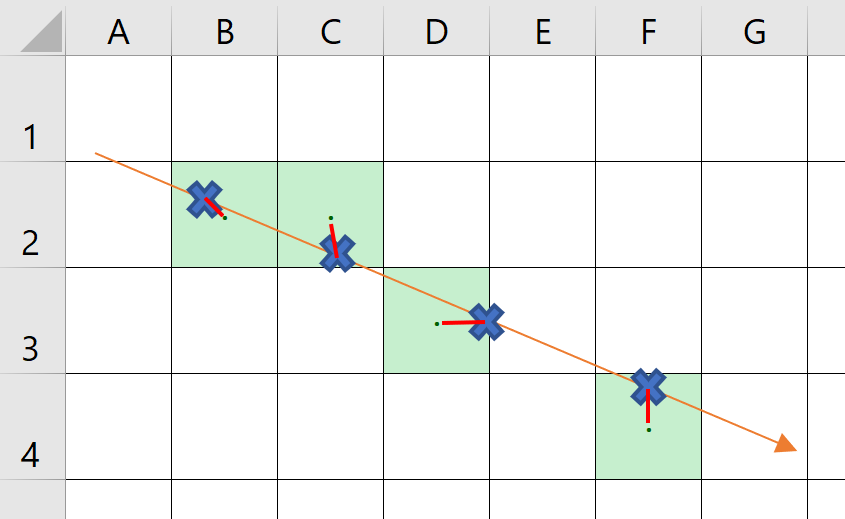
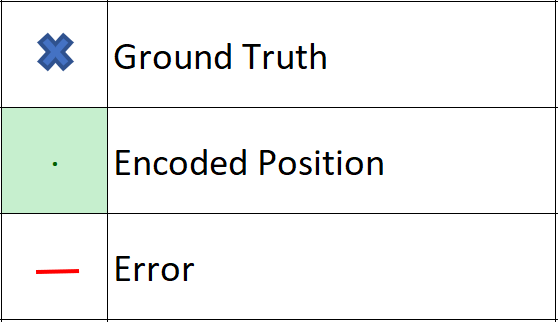
Calculating the error in the rasterizer
Each history position, each lane, each other agent has encoded into pixels, and our net is only able to predict the next positions on the map with pixel-level accuracy.
In many notebooks, the raster has a size of 0.50 m per pixel (hyperparameter). Thus, the expected mean error will be 0.50 / 4 for each direction for each predicted position.
Winning architecture for this competition includes Resnet(18,34,50),EDA,calculating error and Efficientnet(b1,b3 & b6) for the code please check this Github repo:
rashmimarganiatgithub/LYFT2020
Lyft Motion Prediction for Autonomous Vehicles :2020 was originally published in Towards AI on Medium, where people are continuing the conversation by highlighting and responding to this story.
Related posts
Popular posts

 for 2021")


Updates

Recent Posts